
Road accidents are not only taking thousands of lives in Kenya; they are also creating an enormous economic burden. When launching the National Road Safety Action Plan 2024–2028, the Ministry of Roads and Transport estimated that road carnage costs the Kenyan economy approximately KSh450 billion annually.
This figure does not represent a single bill paid by the government. It combines medical expenses, lost productivity, damaged vehicles, insurance claims, emergency response, cargo losses, traffic delays and the long-term financial consequences of death and disability.
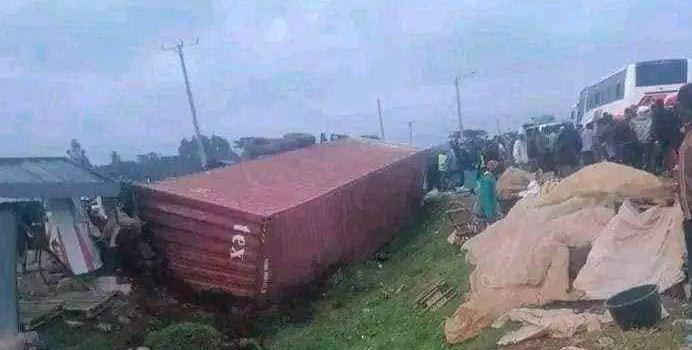
Image of a road carnage by Kenya channel
Kenya has identified numerous accident black spots, but many available lists remain static documents. A location may appear on a list without exact coordinates, recent crash numbers, identified causes or information showing whether the underlying hazard has been corrected.
To reduce the KSh450 billion burden, Kenya needs to move towards live accident black-spot mapping supported by road-condition reports, crash data and responsible driver monitoring.
Where Are the Major Accident Black Spots in Kenya?
A National Police Service document identifies approximately 78 risky road sections across Nairobi, Central, Eastern, Coast, Rift Valley, Western, Nyanza and North Eastern regions. According to the document, these sections are considered dangerous because of the number of accidents recorded in their vicinity.
The listed Nairobi accident black spots include:
- Waiyaki Way near Kangemi Flyover
- Westlands Museum Roundabout
- Westlands–Kabete Road
- Kasarani GSU stretch
- Jogoo Road near Maziwa Stage
- Mombasa Road between Airtel headquarters and City Cabanas
Other high-risk sections include Limuru–Uplands, Kinungi–Naivasha–Gilgil, Salgaa, Mtito Andei–Tsavo River, Salama–Sultan Hamud, Mlolongo–Small World Club and sections of the Nairobi–Mombasa highway.
The Police list is useful because it alerts motorists to historically risky locations. However, it does not explain how many crashes occurred, when they happened, what caused them or whether the risk remains unchanged today.
What Does EPRA’s Driver’s Handbook Reveal?
EPRA’s Nairobi and Central Region Driver’s Handbook provides another layer of road-safety information. It was developed primarily for petroleum tanker drivers, but the risks documented are relevant to trucks, buses, matatus, motorcycles and private motorists.
Instead of merely listing locations, the EPRA handbook records physical hazards and circumstances associated with crashes. These include:
- Speeding and reckless overtaking
- Driver fatigue
- Brake and electrical failure
- Faded lane markings
- Overgrown roadside vegetation
- Narrow or worn-out shoulders
- Missing guardrails
- Pedestrians entering roads unexpectedly
- Undesignated pedestrian crossings
- Livestock and wildlife crossings
- Roadside hawkers and markets
- Poor visibility during rain or darkness
- Tankers and trucks parked beside the road
For example, the Police document identifies Waiyaki Way near Kangemi Flyover as an accident black spot. EPRA separately identifies shrubs between the carriageways on Waiyaki Way as a visibility-related road hazard.
These findings do not conflict. The Police list shows where accidents have historically occurred, while EPRA’s survey helps identify conditions that could contribute to future accidents. Combining the two forms of information would provide a more complete picture of road risk.
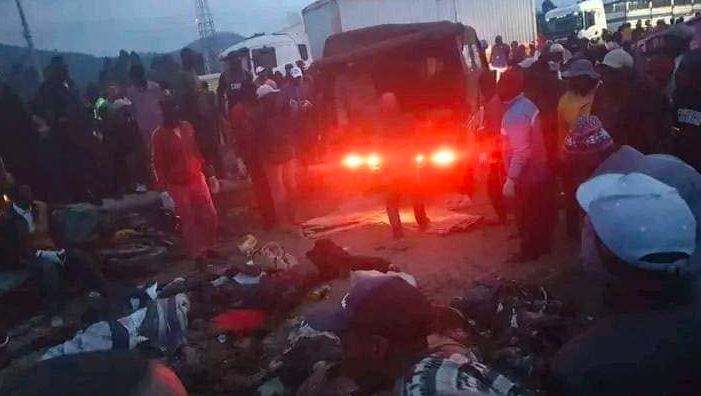
Image of a road carnage by Kenya channel
Why Static Accident Black-Spot Lists Are Not Enough
A black-spot list can warn drivers, but road risks constantly change. Vegetation grows, lane markings fade, new markets develop, roadworks begin and matatu stages emerge. A previously dangerous junction may be redesigned, while a new hotspot may develop elsewhere.
Some dangerous locations may also remain invisible because motorists repeatedly experience near misses without reporting them. Authorities may only recognise a new black spot after several people have already been killed.
Kenya therefore needs a continuously updated digital system rather than relying entirely on periodically published PDF lists.
A live road-safety map could show:
| Data layer | Information provided |
| Crash history | Number, severity and frequency of crashes |
| Road condition | Potholes, faded markings and damaged guardrails |
| Road environment | Schools, markets, crossings and matatu stages |
| Weather risk | Rain, fog, flooding and poor visibility |
| Vehicle activity | Sudden braking, congestion and dangerous speeds |
| Hazard reports | Near misses and observations submitted by drivers |
Each black spot should have exact GPS coordinates, the date it was last assessed, recorded risk factors and any corrective action taken.
How Driver Tracking Could Prevent Accidents
Commercial fleets already use GPS devices to locate vehicles. However, the same technology can be used for safety rather than location alone.
A fleet-safety system could monitor:
- Speeding
- Harsh braking
- Rapid acceleration
- Dangerous cornering
- Excessive continuous driving hours
- Night-time driving
- Repeated violations near schools and markets
- Entry into known high-risk road sections
- Vehicle inspection and maintenance history
Drivers approaching a location such as Kangemi Flyover could receive an audible warning instructing them to reduce speed and increase their following distance.
Fleet managers could also identify patterns. If numerous vehicles brake suddenly at the same GPS coordinates, the location may contain an unmarked bump, concealed junction, pedestrian crossing or another emerging hazard. Authorities could investigate it before serious crashes occur.
Driver tracking should be implemented transparently and used primarily for coaching, prevention and rewarding safe driving—not merely for punishment. Drivers should understand what information is collected, how their safety score is calculated and who can access their personal data.
Public road maps should preferably display aggregated and anonymised information rather than exposing the movements of individual drivers.
Who Would Benefit From Live Road-Risk Mapping?
A national road-risk intelligence system would serve more than government agencies. It could help:
- Truck, bus and delivery-fleet operators
- Insurance companies
- Banks financing commercial vehicles
- Petroleum transporters
- Driving schools and driver-training institutions
- Ambulance and emergency-response providers
- Road construction and maintenance agencies
- Logistics companies and cargo owners
- Private motorists and motorcycle riders
Insurers could use verified safety improvements to encourage responsible fleet management. Fleet owners could reduce vehicle downtime, repair expenses and cargo losses. Road agencies could prioritise the sections where corrective work would produce the greatest safety benefit.
From Accident Reporting to Accident Prevention
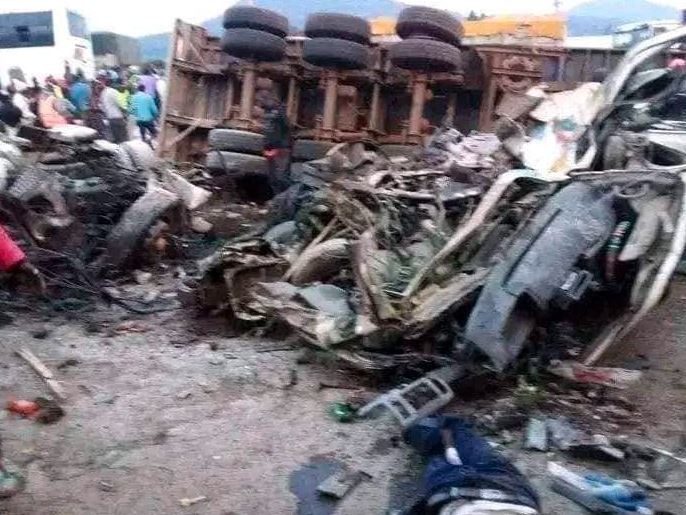
Image of a road carnage by Kenya channel
Kenya already possesses valuable road-safety information, but it is distributed across Police records, NTSA statistics, road-agency assessments, EPRA surveys, hospital records, insurers and private fleet-tracking platforms.
The next step is not simply producing another black-spot list. It is bringing these datasets together to create an updated view of where accidents occur, why they occur and what intervention is required.
If road crashes cost Kenya an estimated KSh450 billion every year, then investing in accurate mapping, driver training, safer infrastructure and fleet intelligence is not merely a transport expense. It is an economic investment.
Kenya must move from documenting dangerous roads after people die to identifying and correcting risks before the next fatal crash occurs.